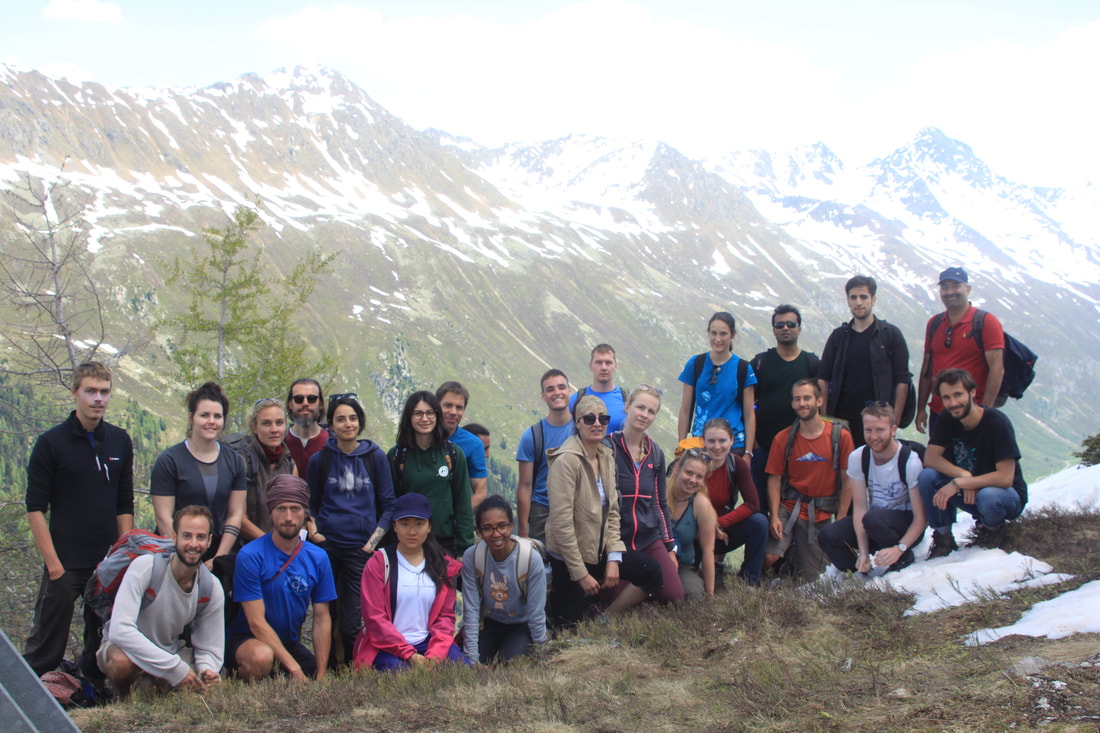
The Class Mountain Forest Ecology of ETH Zuirch.
The course conducted in the Dischma valley Davos Switzerland. BSc and MSc level students participated from ETH Zurich, Switzerland, University of Freiburg, Germany, and University of Lorraine France.
The course conducted in the Dischma valley Davos Switzerland. BSc and MSc level students participated from ETH Zurich, Switzerland, University of Freiburg, Germany, and University of Lorraine France.
Course Description:
Course designator and number: SFR 601-0984
Graduate level, 1 credit hours
Mornings: 8:30 to 12:00; Afternoons 1:00 pm to 4:30 pm of January 9-13, 2017
Room 213, Nutting hall, University of Maine, Orono, Maine, USA
Course Rationale:
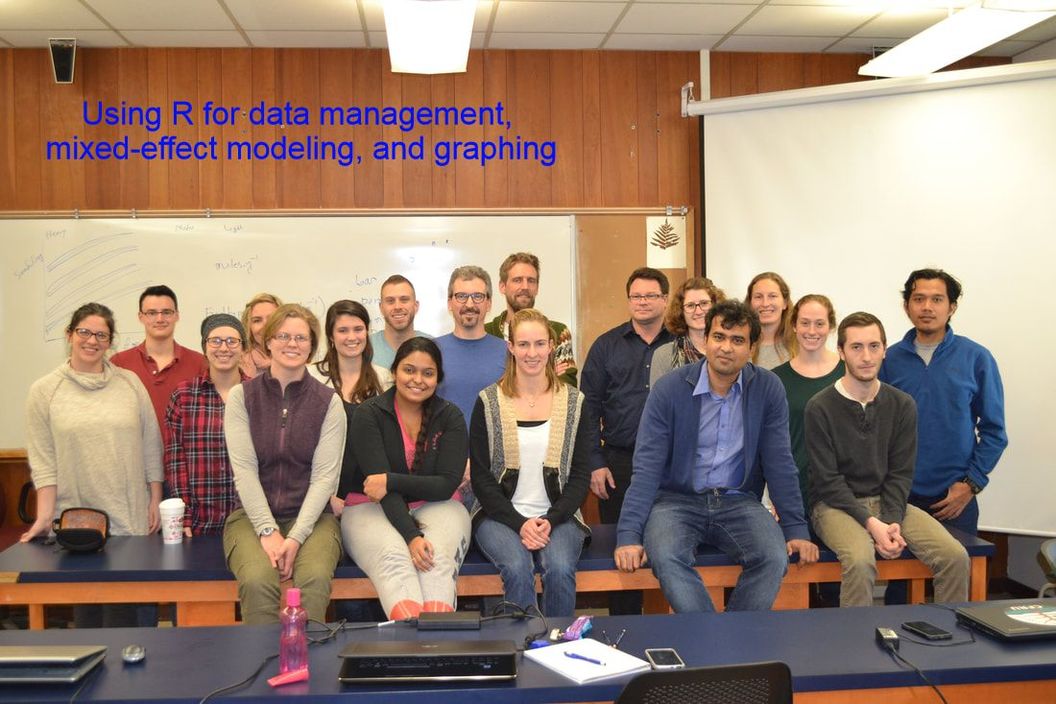
The goal is to learn enough about R to be comfortable with large dataset, basic data exploration and manipulation, able to run the most commonly used mixed-effects models, interpreting the outcomes of the mixed-effect models, and able to produce quality graphics for scientific publications.
Course Structure and Organization:
It will be an intensive 35 hours course (7 hours*5=35 hours), that will be conducted over a week (Monday to Friday). The course will be designed into three phases. The first phase (day-1 & 2) will cover the data handling and manipulation, whereas the second (day 3& 4) and third (day 5) will cover the mixed-effects models and the graphics using ggplot2, respectively. Lectures, when needed, will be given during the morning. Any remaining time is meant for lab work, i.e., using R on laptop computers. The instructor will be available to help and answer questions during lab periods.
Student Learning Outcomes
After completing the course, the student will:
Acknowledgements:
Thanks to Dr. Aaron Weiskittel, Dr. William Livingston, and Shannon Field for all support.
Course designator and number: SFR 601-0984
Graduate level, 1 credit hours
Mornings: 8:30 to 12:00; Afternoons 1:00 pm to 4:30 pm of January 9-13, 2017
Room 213, Nutting hall, University of Maine, Orono, Maine, USA
Course Rationale:
The goal is to learn enough about R to be comfortable with large dataset, basic data exploration and manipulation, able to run the most commonly used mixed-effects models, interpreting the outcomes of the mixed-effect models, and able to produce quality graphics for scientific publications.
Course Structure and Organization:
It will be an intensive 35 hours course (7 hours*5=35 hours), that will be conducted over a week (Monday to Friday). The course will be designed into three phases. The first phase (day-1 & 2) will cover the data handling and manipulation, whereas the second (day 3& 4) and third (day 5) will cover the mixed-effects models and the graphics using ggplot2, respectively. Lectures, when needed, will be given during the morning. Any remaining time is meant for lab work, i.e., using R on laptop computers. The instructor will be available to help and answer questions during lab periods.
Student Learning Outcomes
After completing the course, the student will:
- develop skills necessary to read, manipulate, and summarize large datasets;
- be familiar with commonly used “mixed-effects models”, the rational of using mixed-effect models, and how different data distribution (normal, count and binomial) can be dealt using various forms of “mixed-effects models”;
- be able to evaluate the performance of the models having various forms (model structure);
- develop skills necessary to create various types of graphs (scatter plot, bars, lines), and able to manipulate various components (legends, X, Y axis, title) and the aesthetics (color, shades, sizes) of those components of different types of graphs.
Acknowledgements:
Thanks to Dr. Aaron Weiskittel, Dr. William Livingston, and Shannon Field for all support.
